ARM: Source-level Debugging
This example uses ImageCraft ICCARM,
as described in the previous section of the tutorial, Compiling for Source-level Debugging.
You can follow along even if you don't have this compiler. All files necessary for
you to run the NoICE demo may be downloaded here: hellofoo.zip.
Setup for other compilers is generally similar.
Debugging hellofoo
|
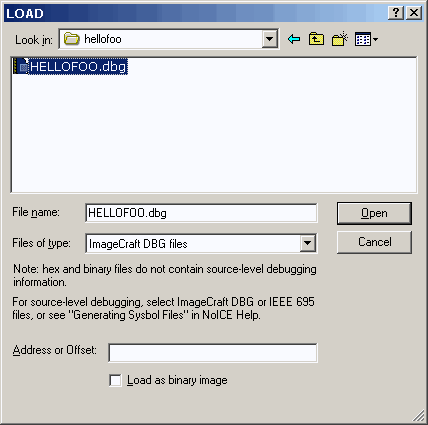
Run NoICE. Select "File", "Load...".
By default, you will see hex files such as hellofoo.hex. You could load that, but
all you would get would be disassembly, as the hex file doesn't contain any symbolic
debug information.
So change the "Files of type" to"ImageCraft DBG files".
Navigate to hellofoo.dbg and press "OK".
NoICE help on LOAD
|
 |
|
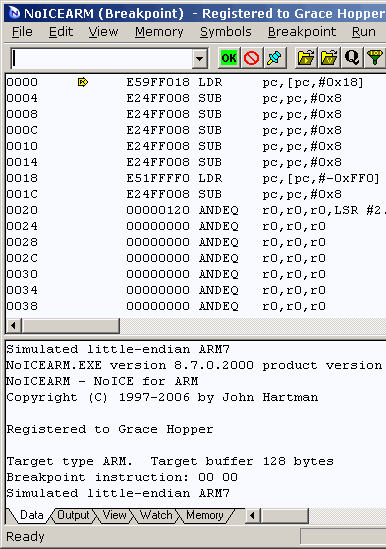
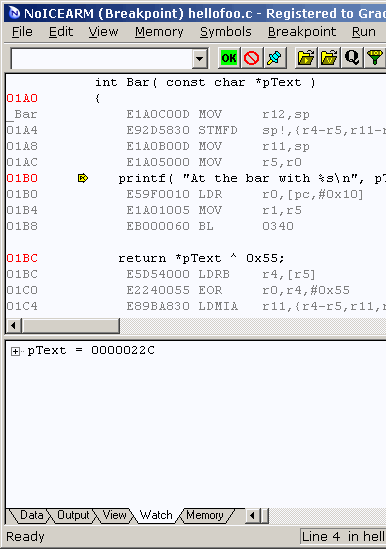
The result looks like this.
Why don't you see the code at main? The answer is part geek and part philosophy:
main is the first C code of your program, but it is not the first instruction
executed by the processor after reset. That honor rests with the C startup code,
which initializes the stackpointer, clears memory, and does assorted I/O
initialization. After all that, it calls main.
Some debuggers hide all the low-level stuff from you and execute until main before
showing you anything. My opinion is that hiding low-level stuff is not a good thing
when working on embedded systems: there are times when you want to step through
the startup code, or set a breakpoint in the midst of it.
So, NoICE loads the code and sets the PC to the first instruction of the startup
code. If you were running without NoICE, this is where the reset vector would point.
If you want to skip over the startup code (and you usually do, once you
have verified that it works), you could set a breakpoint at main, and then execute
'til there:
   B main
   G
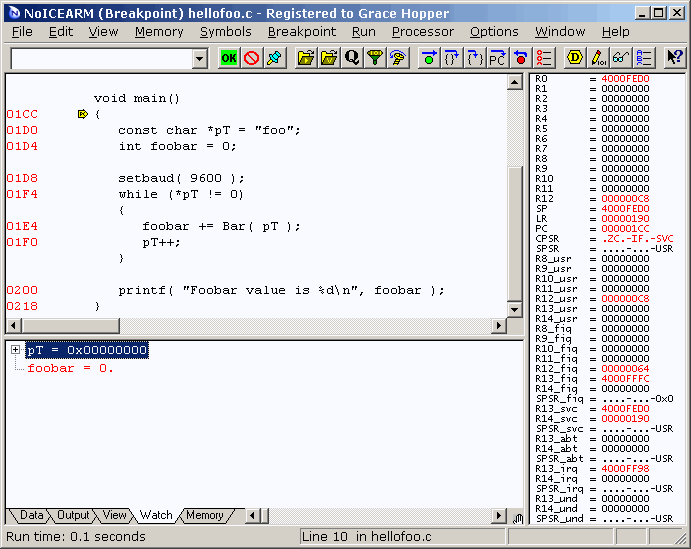
This should stop at main and show you the source code there.
Since you are Loading an ImageCraft DBG file, NoICE can do this automatically for
you.
Select "Run", "Go until main after LOAD".
The next time you load a DBG file, NoICE will run from the start location until
main (presuming that your startup code works and the program ever gets there...).
|
 |
|
Here we have also selected the option "Memory", "Watch All Locals". Thus,
the values of all local variables are shown in the Watch window.
More about Watches later.
|
 |
Source-level Single-step
|
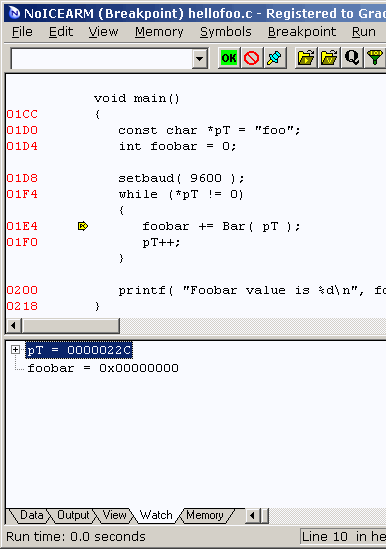
If you single-step, you will now step by lines of C code rather than by
processor instruction.
Use "Step Over" or the F10 function key to step down to the call to Bar().
To step into the function Bar(), use "Step Into" or the F11 function key.
To step over the function Bar(), use "Step Over" or the F10 function key.
If you really want to step one processor instruction, use "Instruction Step" or the F9 function key.
Breakpoints work just as they do in disassembly mode.
|
 |
Mixed Source/disassembly mode
|
To see the assembly code that corresponds to the C code, select
"View", "Mixed source/disassembly".
Or click on the toolbar button
that looks like a screwhead drawn by a programmer whose artistic
skills never advanced past third grade.
|
 |
Simulated UART Output
|
Return to source mode by selecting "View", "Mixed source/disassembly" again.
Use Step Over to step over a call to Bar(). You may observe a flash as
the Output view briefly comes to the foreground, and is then replaced by the
Watch view.
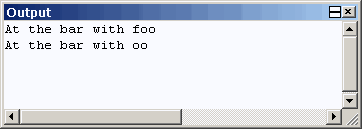
Click on the "Output" tab to view the characters sent by your program to
the simulated UART.
If you have enough screen space, you may want to turn either the Output or
the Watch view into a free-floating window. To do so, just double-click
on the view's tab. Turn return the window to being a tab, just click its
closer box.
NoICE help on the Output Window
|
 |
If you are running this program on real hardware rather than the simulator, you
won't see anything in the Output tab. You have a real UART, and its
output is being sent to a pin on the ARM chip, and from there to an RS-232 connector
or whatever your hardware connects it to.
If you want to see this output, you will need to connect your target's serial
port to a serial port on your PC and use a terminal emulator such as
HyperTerminal to see the output.
More on Watches
|
We previously selected the option of watching all local
variables. You can also manually add watches for static or global variables.
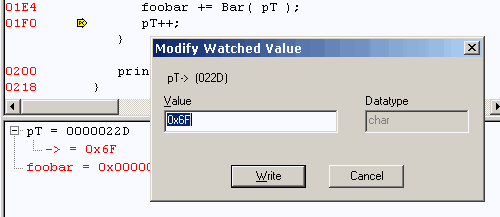
Double-clicking on a watch value brings up the Modify Watch dialog and
allows you to change the value of the watched variable.
NoICE help on Watches
|
 |
Well, that's the end of the tutorial. We hope it was useful.
The best thing to do now is to run NoICE and try things. If something doesn't make
sense, or if you can't figure out how to do something, take a look at
NoICE help
|

